Common issues
SqliteException: Could not load extension or similar
This client-side error or similar typically occurs when PowerSync is used in conjunction with either another SQLite library or the standard system SQLite library. PowerSync is generally not compatible with multiple SQLite sources. If another SQLite library exists in your project dependencies, remove it if it is not required. In some cases, there might be other workarounds. For example, in Flutter projects, we’ve seen this issue with sqflite 2.2.6, but sqflite 2.3.3+1 does not throw the same exception.
RangeError: Maximum call stack size exceeded on iOS or Safari
This client-side error commonly occurs when using the PowerSync Web SDK on Safari or iOS (including iOS simulator).
Solutions:
- Use OPFSCoopSyncVFS (Recommended): Switch to the
OPFSCoopSyncVFSvirtual file system, which provides better Safari compatibility and multi-tab support:
- Disable Web Workers (Alternative): Set the
useWebWorkerflag tofalse, but note that this disables multi-tab support:
Tools
Troubleshooting techniques depend on the type of issue:- Connection issues between client and server: See the tools below.
- Expected data not appearing on device: See the tools below.
- Data lagging behind on PowerSync Service: Data on the PowerSync Service instance cannot currently directly be inspected. This is something we are investigating.
- Writes to the backend database are failing: PowerSync is not actively involved: use normal debugging techniques (server-side logging; client and server-side error tracking).
- Updates are slow to sync, or queries run slow: See Performance
Sync Diagnostics Client
Access the Sync Diagnostics Client here: https://diagnostics-app.powersync.com This is a standalone web app that presents data from the perspective of a specific user. It can be used to:- See stats about the user’s local database.
- Inspect tables, rows and sync buckets on the device.
- Query the local SQL database.
- Identify common issues. E.g. too many sync buckets.
Instance Logs
See Monitoring and Alerting.SyncStatus API
We also provide diagnostics via theSyncStatus APIs in the client SDKs. Examples include the connection status, last completed sync time, and local upload queue size.
If for example, a change appears to be missing on the client, you can check if the last completed sync time is greater than the time the change occurred.
For usage details, refer to the respective client SDK docs.
The JavaScript SDKs (React Native, web) also log the contents of sync bucket changes to console.debug if verbose logging is enabled. This should log which PUT/PATCH/DELETE operations have been applied from the server.
Inspect local SQLite Database
Another useful debugging tool as a developer is to open the SQLite file and inspect the contents. We share an example of how to do this on iOS from macOS in this video:
Essentially, run the following to grab the SQLite file:
- iOS
- Android
find ~/Library/Developer/CoreSimulator/Devices -name "mydb.sqlite"Client-side Logging
Our client SDKs support logging to troubleshoot issues. Here’s how to enable logging in each SDK:-
JavaScript-based SDKs (Web, React Native, and Node.js) - You can use our built-in logger based on js-logger for logging. Create the base logger with
const logger = createBaseLogger()and enable withlogger.useDefaults()and set level withlogger.setLevel(LogLevel.DEBUG). For the Web SDK, you can also enable thedebugModeflag to log SQL queries on Chrome’s Performance timeline. - Dart/Flutter SDK - Logging is enabled by default since version 1.1.2 and outputs logs to the console in debug mode.
-
Kotlin SDK - Uses Kermit Logger. By default shows
Warningsin release andVerbosein debug mode. -
Swift SDK - Supports configurable logging with
DefaultLoggerand custom loggers implementingLoggerProtocol. Supports severity levels:.debug,.info,.warn, and.error. -
.NET SDK - Uses .NET’s
ILoggerinterface. Configure withLoggerFactoryto enable console logging and set minimum log level.
Performance
When running into issues with data sync performance, first review our expected Performance and Limits. These are some common pointers when it comes to diagnosing and understanding performance issues:- You will notice differences in performance based on the row size (think 100 byte rows vs 8KB rows)
- The initial sync on a client can take a while in cases where the operations history is large. See Compacting Buckets to optimizes sync performance.
- You can get big performance gains by using transactions & batching as explained in this blog post.
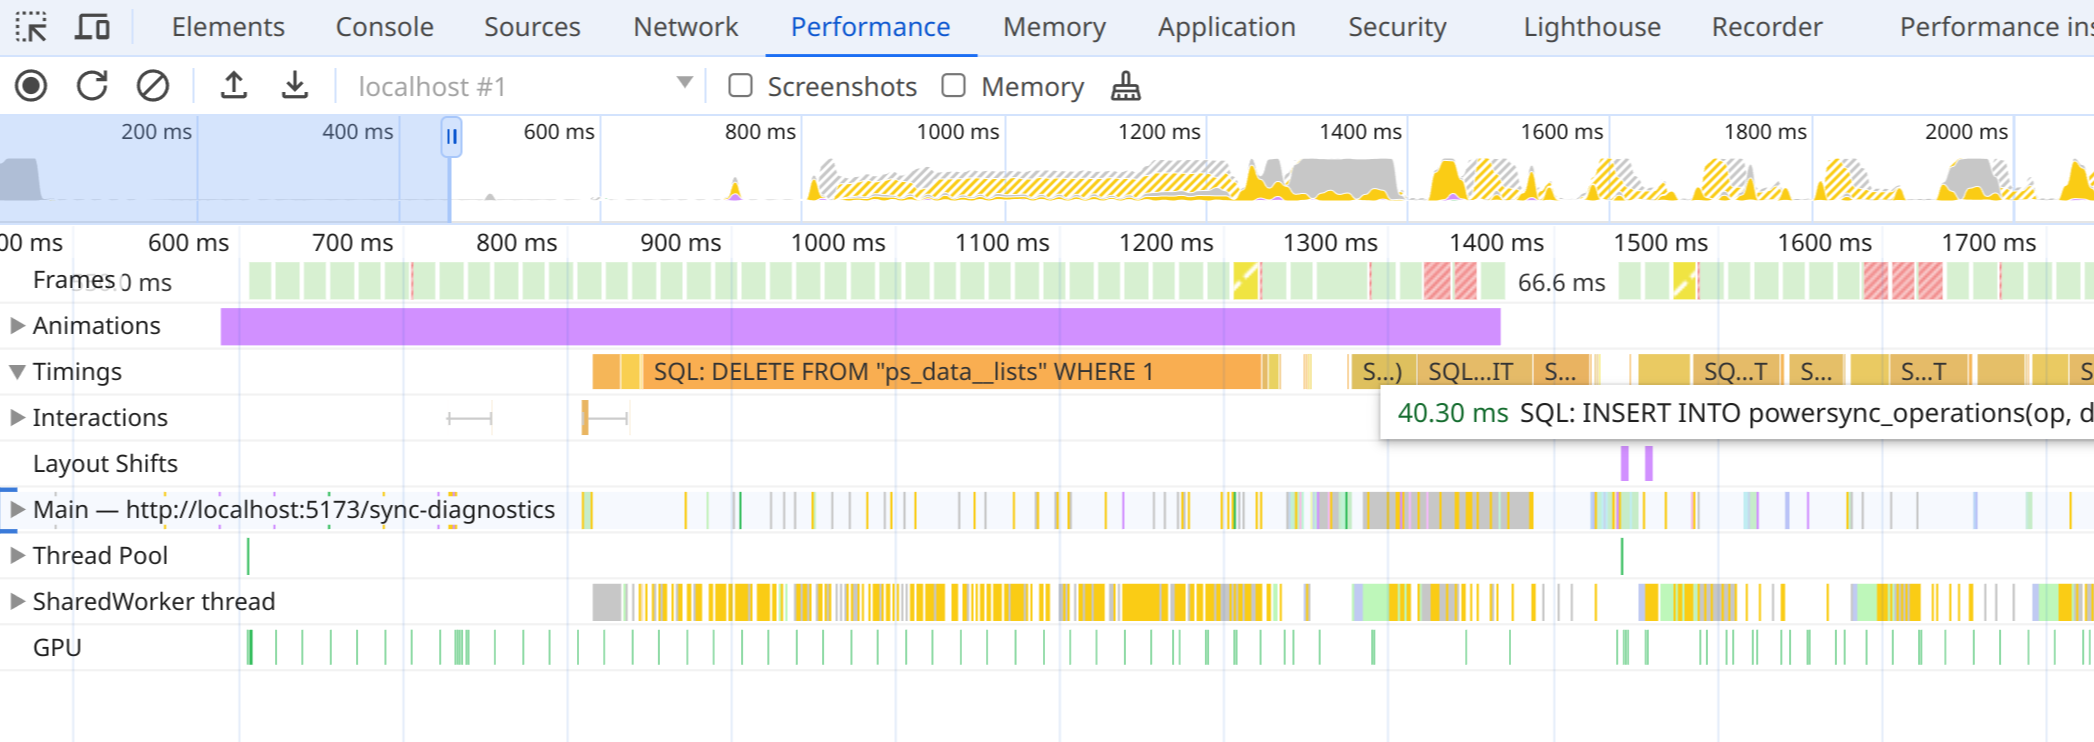
Web: Logging queries on the performance timeline
Enabling thedebugMode flag in the Web SDK logs all SQL queries on the Performance timeline in Chrome’s Developer Tools (after recording). This can help identify slow-running queries.
- PowerSync queries from client code.
- Internal statements from PowerSync, including queries saving sync data, and begin/commit statements.
- The time waiting for the global transaction lock, but includes all overhead in worker communication. This means you won’t see concurrent queries in most cases.
- Internal statements from
powersync-sqlite-core.
PowerSyncDatabse: